

Protecting the Front Lines – An Overview of the WhiteHat Website Security Statistics Report
I recently covered a few sections from the Verizon Data Breach Investigations Report (take a look if you haven’t already). I also mentioned another one of my favorites, the WhiteHat Security Website Security Statistics Report. This report gives an insightful overview of a constantly evolving and frequently targeted attack vector, web applications. Ignoring my strong bias (I may or may not specialize in web application security), it’s one of the most informative, interesting reports you can read this year. The report can be found here.
The authors make some notable points just in the introduction. Web application breaches are so common in this day and age that only the largest breaches gain attention from the media. Think about the breaches you read about in 2014. Home Depot, JP Morgan Chase, and Sony probably come to mind. The full list is impressive (and a little scary). Here’s a few other breaches that occurred during 2014:
| Company | Records Lost |
| Walgreen Co. | 160,000 |
| UPS | 105,000 |
| StubHub | 1,000 |
| Lowe’s | 35,000 |
| Little Caesar’s (glad I only eat Dominos) | 98 |
| North Dakota University | 291,465 |
| Quest Diagnostics | Unknown |
I have to be honest, I had a hard time picking just a handful of examples. I found a very detailed list at the Identity Theft Resource Center here that details each breach for each category, as well as the number of records lost (if known). Let’s dive into the fun stuff.
Vulnerability Likelihood
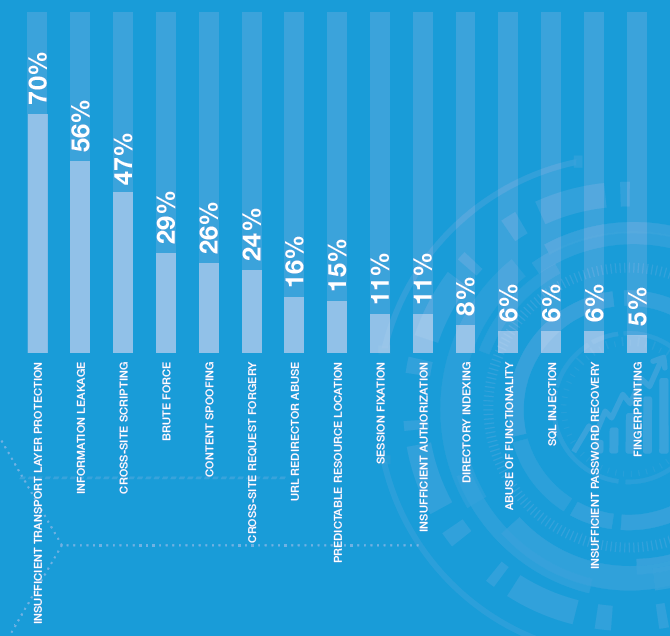
These numbers weren’t entirely shocking to me. Coming in at #1 is insufficient transport layer protection, affecting 70% of all applications. With all the recent SSL/TLS zero-days, it’s not shocking. From 0% in 2010 to 70% likelihood in 2014, it’s become the vulnerability to look out for. From my experience, the problem stems from the difficult process of upgrading everything on the back-end to be compatible with TLS 1.2. It’s important for management and executives to understand the risks of leaving a vulnerability like this open. Heartbleed is being blamed for one of the largest data breaches in the medical industry. In April of 2014, Community Health Systems Inc. was breached, exposing personal data of 4.5 million patients. The PCI-DSS standards make it perfectly clear that TLS 1.2 is absolutely necessary, as well as disabling any weak encryption ciphers to ensure that your sensitive data is being transported as securely as possible.
Coming in second is information leakage at 56%. These numbers haven’t change much from the 58% in 2012. Honestly, this is the bane of my existence. The moment I find one stack trace, I know the rest of them are going to come crawling out of the walls like cockroaches. Please, developers of the world, e.printStackTrace() is not the answer to every error or application failure.
And finally third, your favorite and mine, cross site scripting. There’s good news though, there has been a significant decline in the number of applications affected by cross site scripting. In 2014, the likelihood of an application being vulnerable to cross site scripting is 47%, compared to 53% in 2012. All those meetings and walk-throughs are finally paying off!
There are some variations throughout different industries. The table below shows the likelihood of each vulnerability in each industry:
| Insufficient Transport Layer Protection | Information Leakage | Cross Site Scripting | |
| Retail Trade | 75% | 64% | 62% |
| Health Care/Social Asst. | 73% | 67% | 56% |
| Information | 65% | 53% | 50% |
| Finance/Insurance | 76% | 60% | 46% |
Compared to all the industries, the information sector is doing pretty well for itself with two of the lowest likelihoods. I wouldn’t call it secure with a 65% likelihood of having insufficient transport layer protection, but that’s a significant improvement over the 76% in the financial/insurance sector.
Surveys on Surveys on Surveys
WhiteHat provides an analysis based on survey responses from 118 security professionals. The data gathered from this gives a clear view of how application security programs affect various organizations. A couple of things to note before diving into a couple of sections:
- Information and Finance/Insurance have the highest number of responses
- There is not enough data from the other industries to draw meaningful conclusions
Who is held accountable if there is a data breach?
| Average Open Vulnerabilities | Average Time Open | Average Time to Fix | Remediation Rate | |
| Board of Directors | 8 | 461 | 159 | 40% |
| Executive Management | 8 | 410 | 152 | 31% |
| Software Development | 12 | 400 | 145 | 19% |
| Security Department | 19 | 342 | 145 | 29% |
Pretty interesting. When the board of directors is held accountable, open vulnerabilities are at their lowest and remediation rates are at their highest. Although, when the security team is held accountable, there average number of open vulnerabilities is highest.
What is your organization’s driver for resolving vulnerabilities?
| Average Open Vulnerabilities | Average Time Open | Average Time to Fix | Remediation Rate | |
| Compliance | 12 | 352 | 158 | 86% |
| Corporate Policy | 17 | 294 | 140 | 0% |
| Risk Reduction | 23 | 326 | 115 | 18% |
| Customer Demand | 18 | 559 | 191 | 40% |
| Other | 8 | 394 | 169 | 25% |
Yeah, that seems about right to me. A 0% remediation rate when corporate policy is the driver for remediation. I’ve been on conference calls about some vulnerabilities, and the moment I mention it’s corporate policy I’m pretty sure they mute their phones to laugh. That all changes when I send them the excerpt from the PCI-DSS standards. Remediation driven by compliance yields the highest remediation rate at 86%. Another number to note, when customer demand is the driver for resolving vulnerabilities, the average time open sky rockets to 559 days (holy $#!+).
How often does the QA team perform basic adversarial test?
| Each Major Release | Quarterly | Never | |
| % Frequency | 32% | 11% | 21% |
| # Open Vulnerabilities | 12 | 9 | 34 |
| Average Time Open | 383 | 391 | 295 |
| Remediation Rate | 19% | 50% | 11% |
How frequently does your organization perform ad hoc code reviews?
| Never | Planned | Each Major Release | |
| % Frequency | 21% | 15% | 15% |
| # Open Vulnerabilities | 35 | 6 | 10 |
I’d love to dive in even further, but there’s just so much information condensed into this report. If you work with application security, I highly recommend taking a look through and applying some of the data and statistics to your team. I was able to find some interesting points to talk about with my team.
Thanks for reading!
